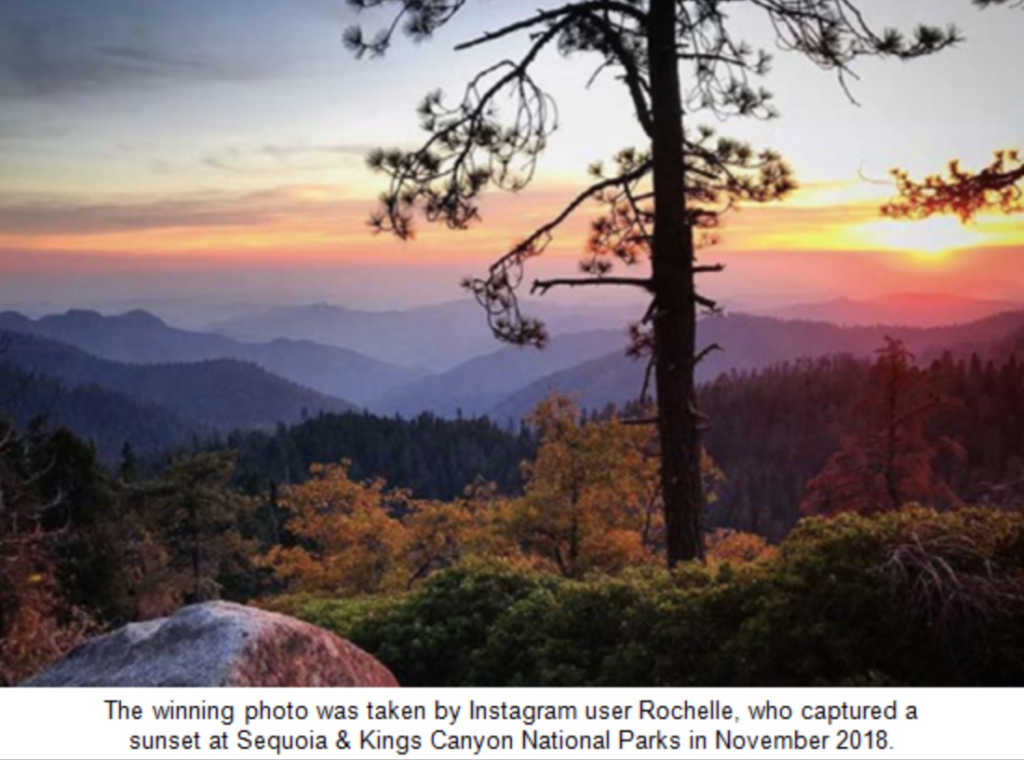
Instagram rocks in new study: More than half of all adults surveyed (by easyJet in Europe) booked their vacations based on Instagram posts. Almost a third of those surveyed said the biggest driver for choosing a leisure destination was based on how good images will look on their Instagram feed. Read more here.
What digital natives think: TripAdvisor does not compare to Google for getting online reviews of travel products in the minds of travelers aged between 18 and 28. Six out of 10 digital natives rely on Google for a source of reviews, the report claims in a study by the University of Applied Sciences with TUI and TrustYou. Another report from Revinate identifies a slowing of online reviews for hotels and backs up the 1-2-3 Google, Facebook, TripAdvisor reviews ranking. Read more here.
In defense of the mid-range blog post: Contently pulls back from previously published research indicating that longer posts are more popular. Not exactly. For a defense of 700-word to 1,000-word posts, read on.
But, it’s too tall for your refrigerator door: “A Look Back at 25 Years of Digital Advertising” published by CMO (Adobe) is the coolest infographic we’ve seen lately. No registration required, either. Get yours here.
Do you read me? On average, there are 43.85 characters in a subject line. AWeber, an email marketing platform, analyzed 1,000 marketing emails from 100 successful small businesses and entrepreneurs across multiple industries and from numerous countries. Get the lowdown here.
Wellness sells: Wellness tourism grew twice as fast as overall tourism last year according to the 2018 Global Wellness Economy Monitor. In the Inventive Research Foundation’s 2018 Trends Survey, 38% of respondents expect wellness components in their programs. Digital Edge Marketing reveals that its recently published whitepaper, “Visit Park City on Wellness Meetings,” has been downloaded so many times, it has quickly become one of the most popular meetings planning tools the DMO has ever issued. Read more here. Read more here.
USA is top of the charts: Here’s how the world looks when you visualize where tourists spent the most money on an infographic world map. Data came from the World Tourism Organization, then each country was color-coded based on the continent and adjusted in size to correspond to the annual amount tourists spent there in 2017 (US$ B). See it here.
Keeping it clean: We like to publish an annual refresher of the cheat sheet to always stay up-to-date on optimal social media image sizes. Here’s a comprehensive one from Sprout Social.
Thanksgiving in the Skies: A new report from U.S. Travel Association cautions that our top 30 domestic airports are headed on a path toward “chronic congestion, delays, and frustration” when two or more days every week feel like the Wednesday before Thanksgiving. Get the report here.
The high end: Looking ahead, worldwide consumer spending on legal cannabis is forecasted to increase dramatically in 2019, growing 38% from the prior year to $16.9 billion. According to The State of Legal Marijuana Markets, 6th Edition (SOLMM6), it is projected to top $31 billion by 2022. More from Destinations International here.


