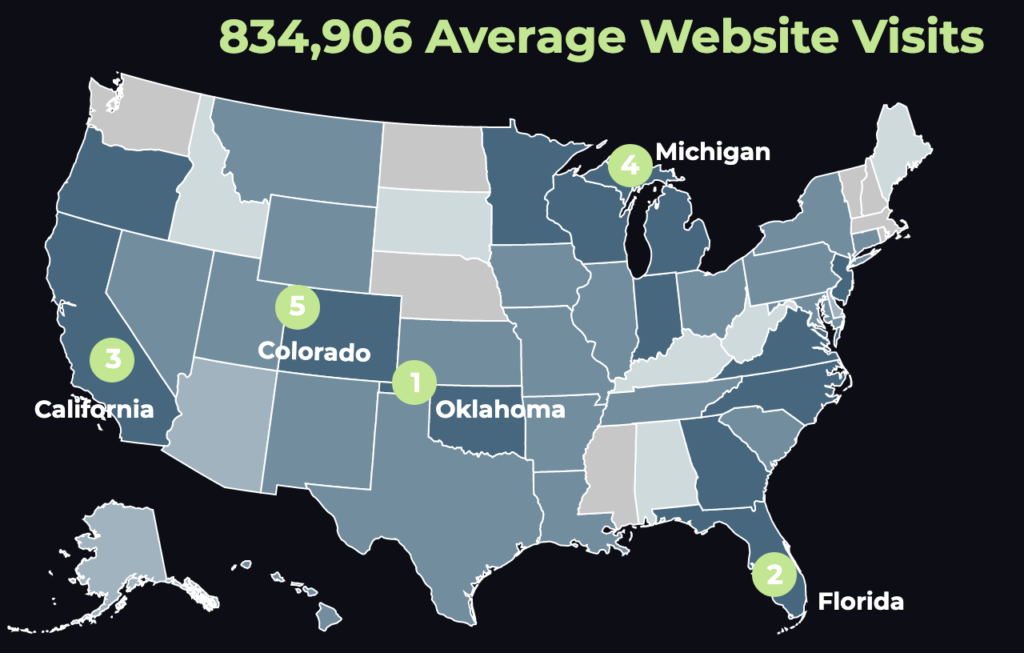
The quarterly analytics and comparative rankings released by TwoSix Digital on state-by-state website traffic and engagement are getting a lot of attention. What does the data actually tell us?

The Travel Vertical was eager to talk to Dave Serino, Founder and Chief Strategist, about the research, the insights, and the takeaways.
Q: Besides total traffic to each of the 50 states’ official destination website, what else are you tracking and benchmarking?
A: We really wanted to take a look at volume of traffic and how that changes seasonally along with learning more about how consumers engage on the state tourism office websites. We also measured mobile vs desktop traffic. We know that mobile traffic is dominant in today’s environment, but it is about 72% over the last three quarters, which was a bit of a surprise to us. We didn’t think it would be that high.
One other measurement we did in Q2 and Q3 was incoming and outgoing traffic. This gives us some perspective on what sites are driving traffic and where consumers are going after they leave the state tourism sites. Organizations can quantify their incoming traffic via Google Analytics, but the downstream traffic is somewhat of a mystery. So, that was interesting to see.
Overall, we’d like to see how things play out over four quarters. We’ll do a nice recap of the 2019 year in Q1 of 2020, but consistency is what we are looking for—what organizations can stay at the top 20% over a one-year period.
Related: Michigan is #1 for Tourism Website Traffic in Q3 of 2019
Q: You have said, “Engagement is the key.” Would you expand on this?
We created a formula based on pages per visit, time on site and bounce rate. This gives us an idea of which sites are retaining traffic. The lower the bounce rate and the higher the pages per visit and time on site gives us an indication of how engaged the user is with the content and information on site.
Q: Are any states absolutely killing with their results?

So, Alaska has been doing very well in terms of the aggregate data. They were first in engagement in Q2, second in Q1 and Q3. When we looked at the outbound traffic this quarter, Alaska had eight of their outgoing top 10 links to tourism partners within the state and last quarter all 10 links went to tourism-related sites. This was really awesome to see when you think about the goals of a state tourism website. They engaged their users most and then sent the majority of traffic to their tourism partners. I think that is pretty exciting and shows they are serving their tourism community well.

One other note on the downstream traffic. We do monitor Discover Puerto Rico also, but don’t include them in the rankings due to the fact that they are technically not a state. But we must give them a shout out on outbound traffic, because they were the only other tourism organization who sent all of their top 10 ten outbound links to tourism industry partners in Q3. That’s only two out of 51 total, which is a pretty impressive accomplishment for both of those organizations.
Q: We notice that less than three minutes’ time on-site is the average. Can you comment on this?
Yes, we are seeing a downward trend in time on-site and pages per visit over the last few years. We’re assuming that this is due to the mobile experience—smaller devices, more niche/interest-driven content and connectivity. The way we are serving up ads with landing pages and social posts, people are reading through one page, then moving on. And, the speed of the networks on mobile are also a factor on this. So, overall, I wouldn’t be alarmed about consumers spending less time on the site.
One of the other measurement criteria we are encouraging tourism organizations to measure is scroll depth. How far through a page or an article are people moving through? If people are only viewing one page, scroll depth is becoming an important factor.
Q: And how about enhancing the data with inbound and outbound links?
The inbound and outbound links are important for a few reasons. First, if you know where your traffic is coming from, you can strategize on how to improve it in the future. The same with the outbound links.
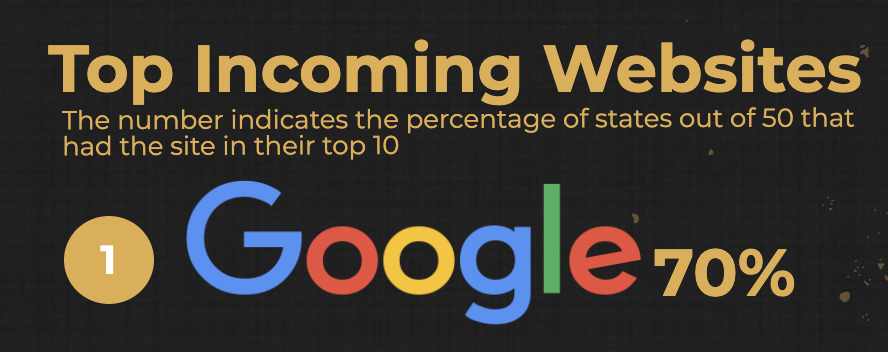
For example, if a majority of your traffic is coming from Google, you can possibly strategize to a little better in the future. Through your own analytics, you can drill down to see what content people are accessing, where they are coming from in terms of DMA and even learn more about their age range and search terms that drove them there. Based on this information, you can accomplish many new objectives. For example, adjusting any PPC campaigns to be more geographic-specific based on past engagement or building out new content pages based on specific keyword demand that you can amplify through other promotional channels.
We’ve done quite a bit of attribution work recently and have learned that many of the Google searches or even direct traffic to tourism websites had an origin from another promotional outlet like Facebook/Instagram ads, etc. So, you can use that source traffic to develop some tangible promotions in the future.

A similar approach can be taken from the outbound traffic. Being an outdoor enthusiast who appreciates all the beauty that our country has to offer, it makes me really happy to see the amount of traffic going out to the National Parks. The challenge for marketers right now is to see how they can build on that traffic trend. What type of partnerships can be enhanced between the states and the national parks and how can that content be expounding on within the website to increase consumer inspiration and drive more engagement? A good example of some offline content that may have been developed from this trend was the Brand USA National Parks Adventure film.
All of this data and insight is great to have, but we have to remind organizations to analyze it and utilize it on a frequent basis to ensure continued success.
Q: Any surprises so far in 2019?
No total surprises. It was a bit of surprise to see the volume of traffic that California had in Q1 and Oklahoma in Q2. But we’re assuming that is based on overall seasonal ad spends. And, Michigan topped Q3, but they have been very consistent over the last eight to 10 years.
The most pleasant surprise was seeing the outbound traffic from Alaska and Puerto Rico supporting their tourism partners so well. Those are the things we love to see as it confirms the process is working the way it should and the state tourism websites are funneling consumers to potential conversion points.
Lastly, we just want to again remind people that this data is being provided via a third-party website analysis application called Similar Web. We would like to emphasize that we do realize these numbers will not be “apples to apples” in terms of overall website visits recorded through Google Analytics or other tracking software installed on an individual website. But, by collectively recording the aggregate data from an identical source utilizing the same methodologies, we can draw a very accurate analysis of the traffic. It paints us a very nice picture!


