
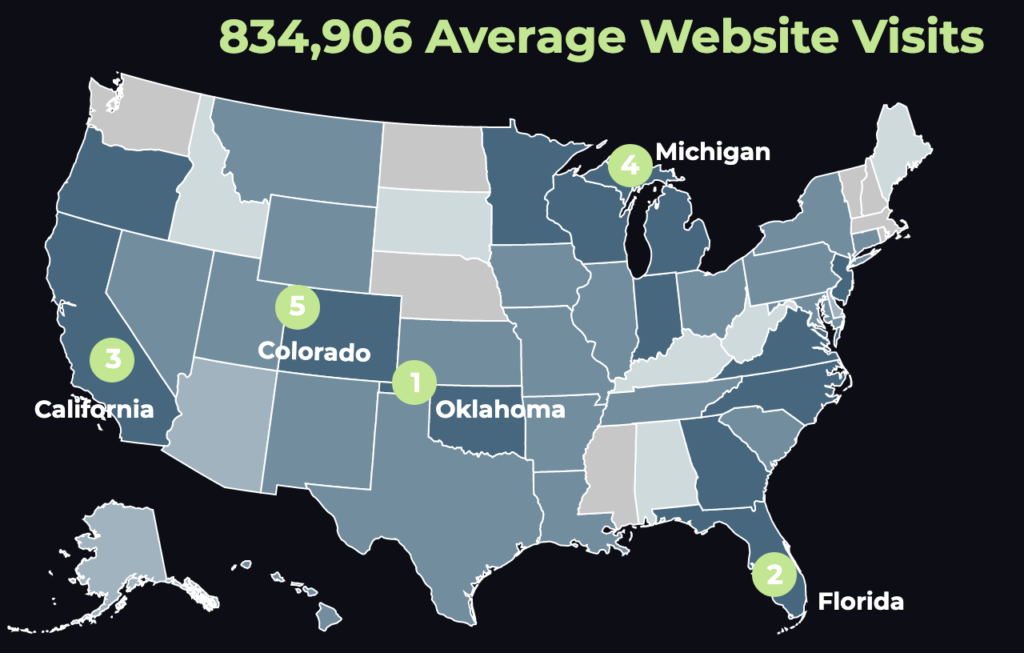
Spoiler alert. With a total of 2.8 million visits—an average of more than 950,000 website visits each month during Quarter 2—Oklahoma took over from top-ranked California in website traffic, also beating out Florida, Michigan and Colorado.

Most engagement? Alaska.
Everybody Wants to Know
Which of the official state tourism websites gets the most traffic? TwoSix Digital to the rescue with the second installation of the state-by-state rankings by:
- total traffic
- average monthly visits
- share of mobile vs. desktop
- pages per visit
- average visit duration
- bounce rate
Find out how your state ranks. Here’s a link to the study from Quarter 1 in case you missed it. And, the busy summer planning results, up 7% overall, for Quarter 2, found here.
Leave a Reply